
Browse the docs
Dashboard reference
Open in dashboardSettings › Usage shows how much AI work your workspace has used, how that compares with your plan's included quota, and whether anything will be charged on top of your plan. It also reports Fast FAQ answers that cost you nothing, plus activity in realtime rooms and the code sandbox.
Every member of the workspace can open this page; it is read-only. Changing your plan or your overage spend cap happens on Settings › Billing, which only admins can change.
Where to find it
Open Settings in the sidebar, then choose the Usage tab at the top. Or go straight to Settings › Usage.
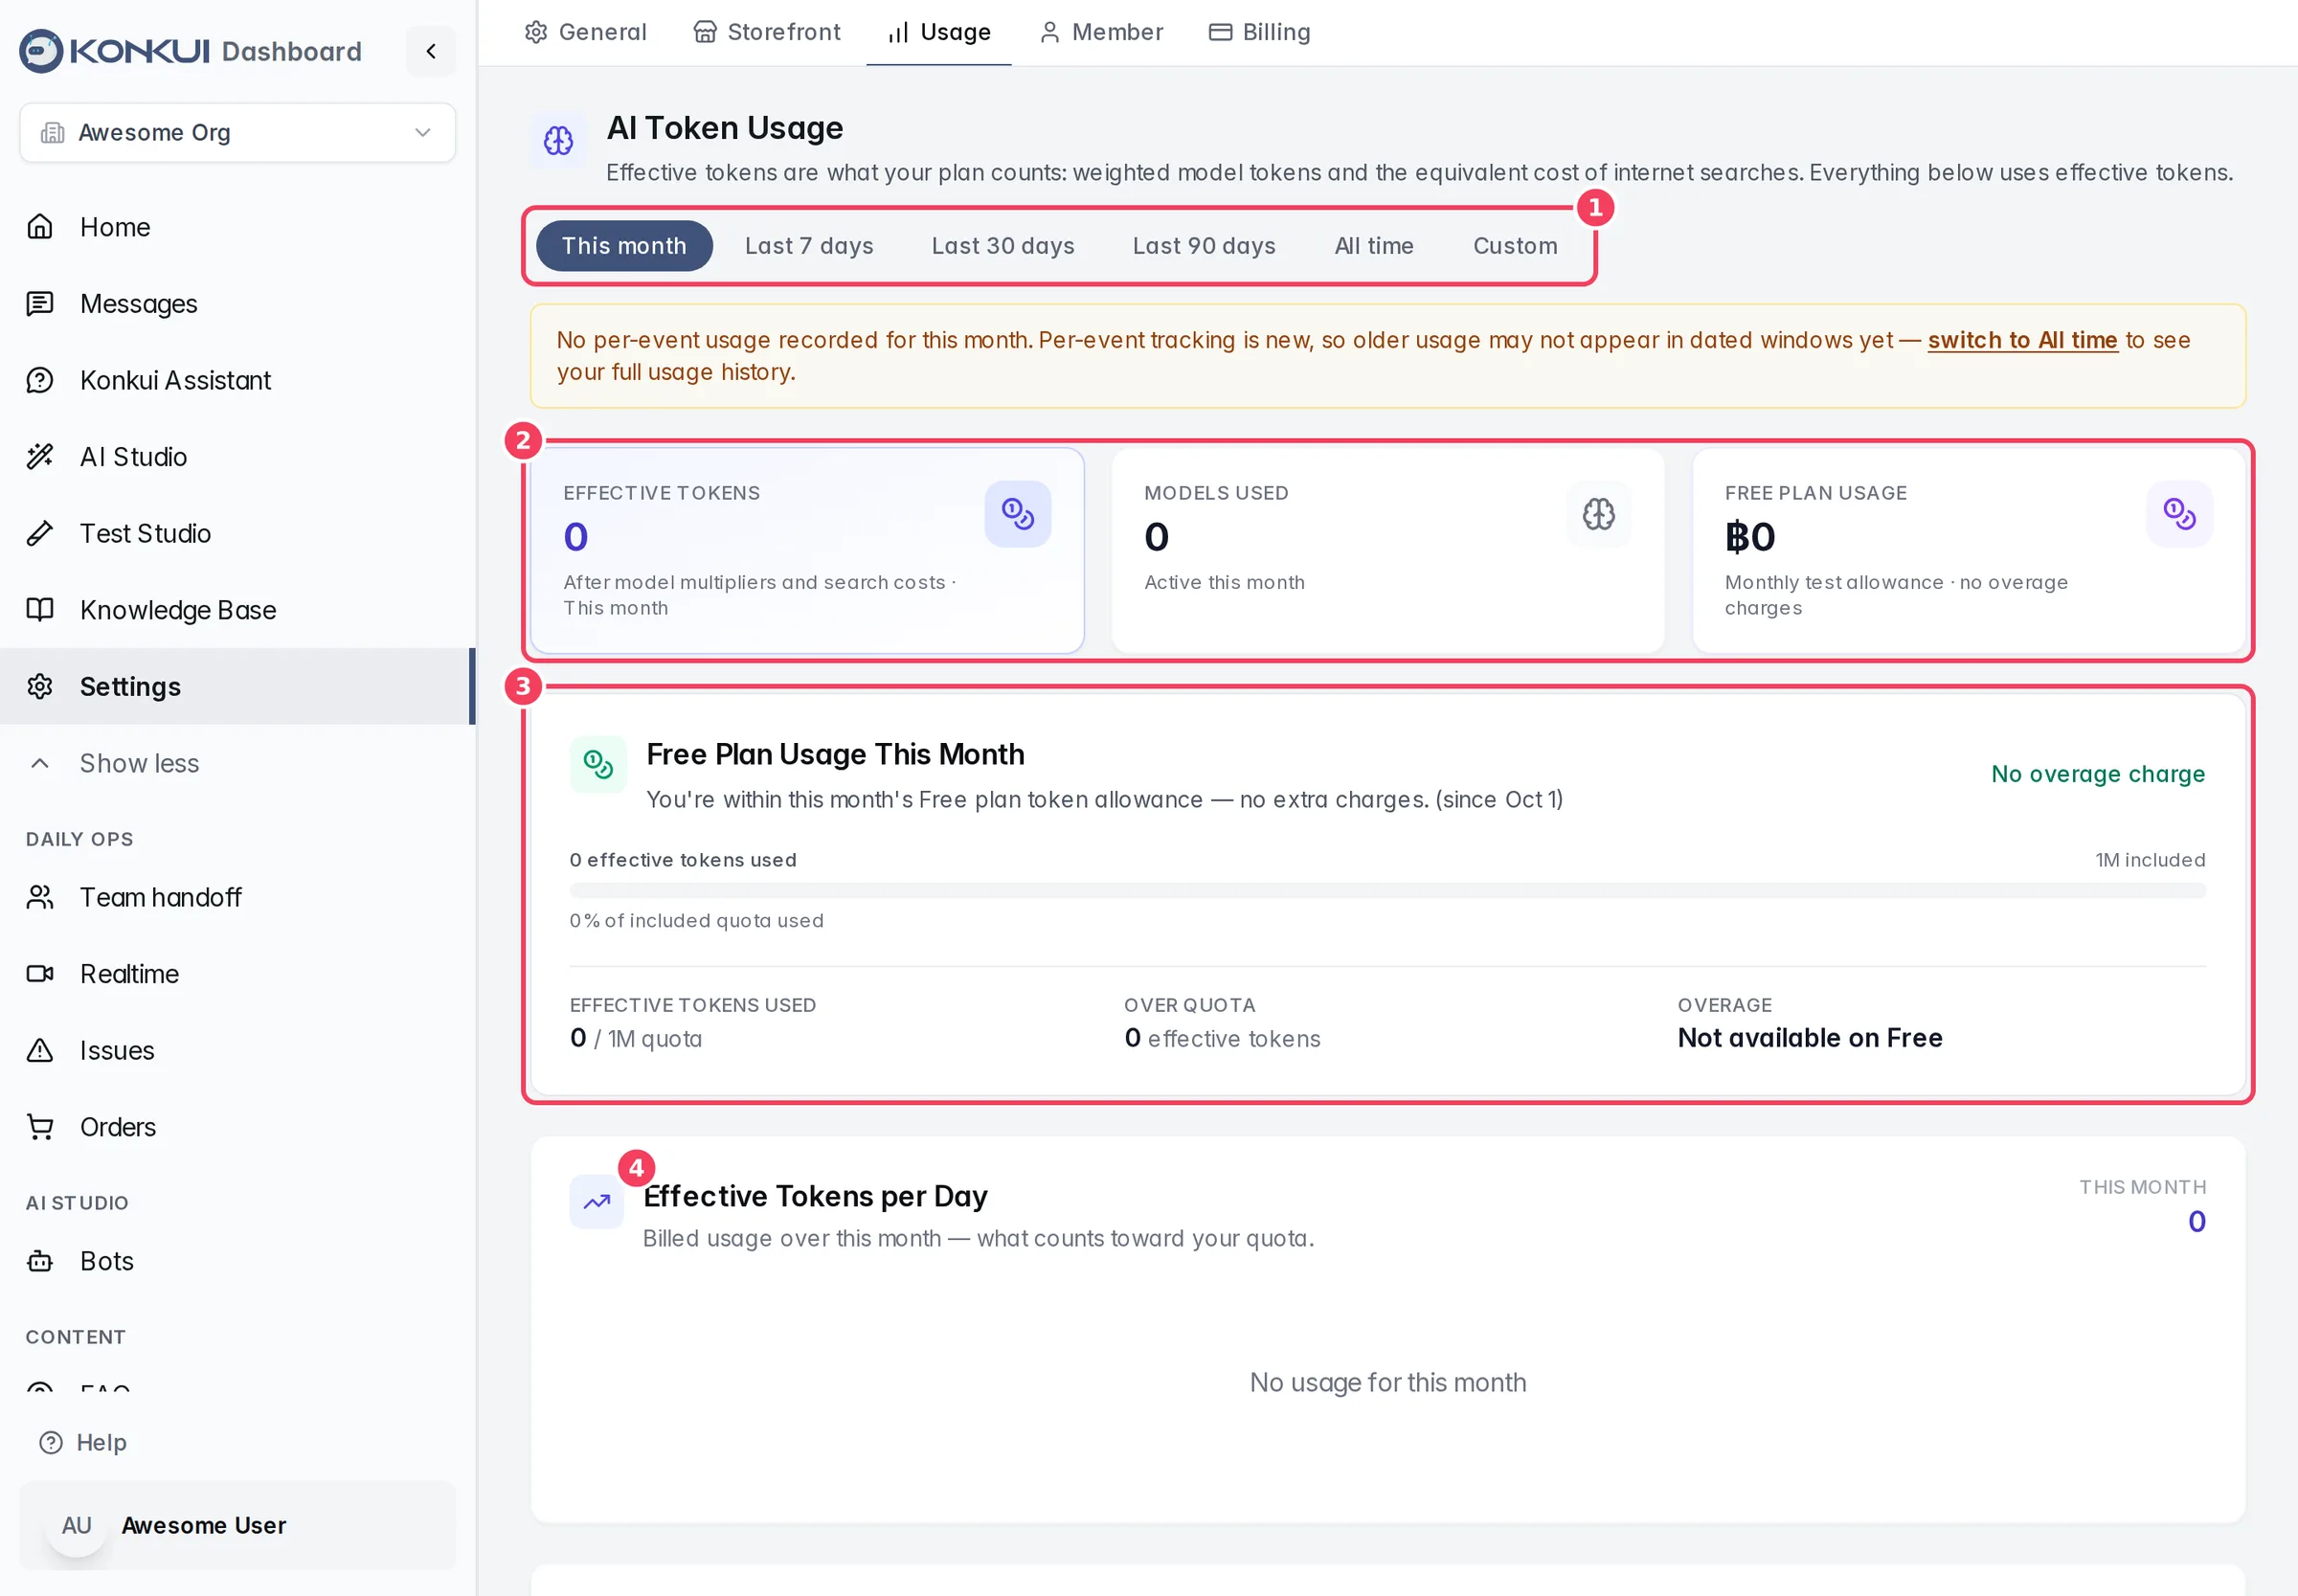
| # | Item | What it does |
|---|---|---|
| 1 | Date-range picker | Chooses the period that every number and chart on the page covers. |
| 2 | Headline metrics | Effective tokens, Models used, and the charge card for the selected range. |
| 3 | Plan usage card | Effective tokens used against your included quota, tokens over quota, and your monthly cap. |
| 4 | Effective Tokens per Day | A daily chart of billed usage for the selected range. |
What "effective tokens" means
Your plan counts effective tokens, not raw model tokens. Each AI model has its own input and output multiplier, so a heavier model uses up your quota faster than a light one. Internet searches the bot runs are converted into an equivalent number of effective tokens, including the search fee and a standard markup.
Every figure on this page is in effective tokens, so the numbers you see are the numbers your quota and bill use.
Choose a date range
The picker at the top drives the whole page: the metric cards, the plan usage card, both charts, the model table, and the realtime and sandbox sections all follow it.
| Option | What it shows | Notes |
|---|---|---|
| This month | Usage since the 1st of the current month. | The default. Months follow UTC. |
| Last 7 days / Last 30 days / Last 90 days | A rolling window ending now. | |
| All time | Your complete cumulative usage. | The plan usage card switches to your live billing period, which is the figure that tracks your actual invoice. |
| Custom | A month or a date range you pick. | See below. |
While a newly picked range loads, the page keeps the previous numbers dimmed and shows an "Updating usage…" message, so values never flash empty.
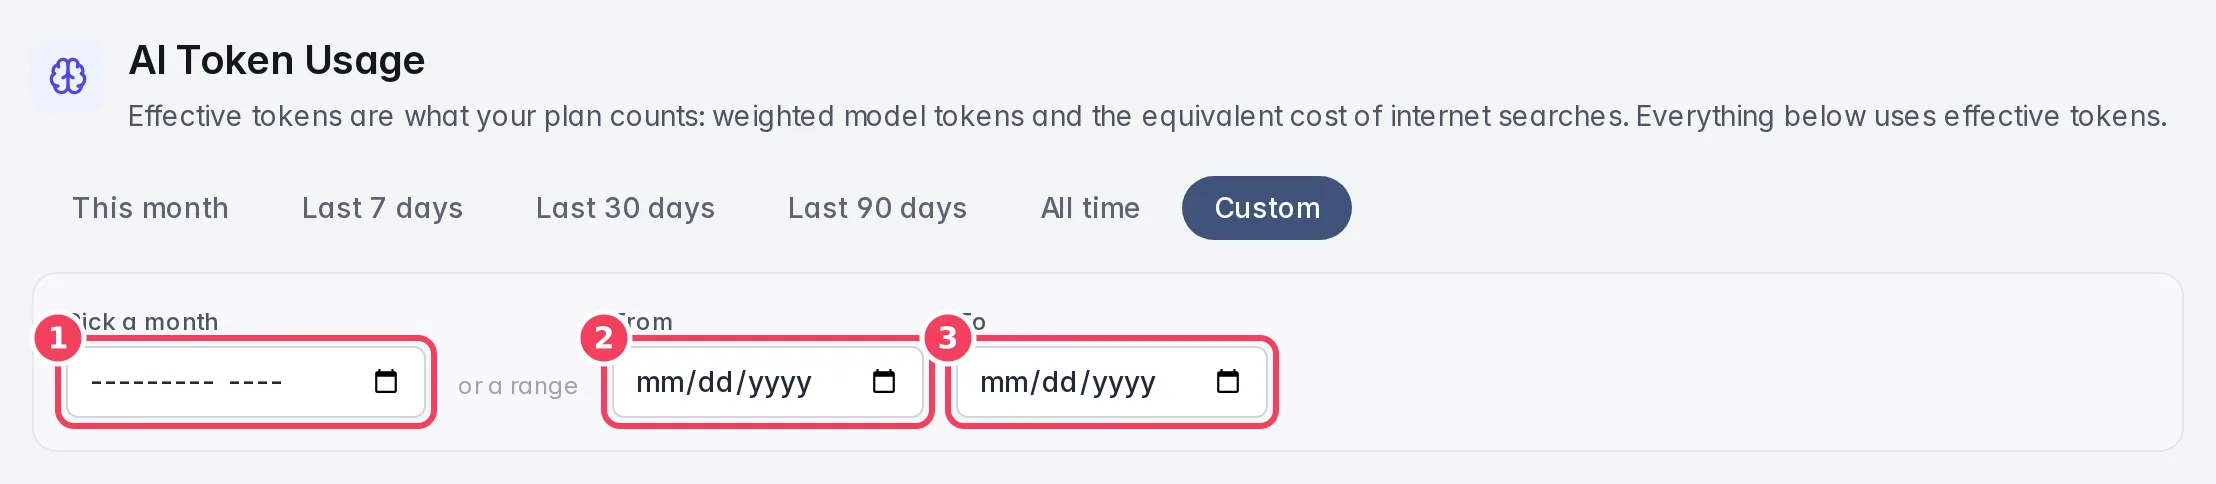
| # | Item | What it does |
|---|---|---|
| 1 | Pick a month | Sets the range to that whole calendar month. |
| 2 | From | The first day of a custom range (inclusive). |
| 3 | To | The last day of a custom range (inclusive). Leave it blank to count up to now. |
Headline metrics
| Card | What it shows | Notes |
|---|---|---|
| Effective tokens | Total effective tokens for the selected range. | After model multipliers and search costs. |
| Models used | How many different AI models were used in the range. | |
| Free plan usage / This period charge / Est. overage | What usage beyond your plan costs. | On the Free plan this is always ฿0. With All time selected it shows the live billing-period charge; with any other range it shows an estimate for that range. |
Plan usage card
This card answers "am I within my plan, and will I pay anything extra?"
| Item | What it shows | Notes |
|---|---|---|
| Status line | Whether you are within your included quota, and the period it covers. | Its title follows the range: Plan Usage This Period (All time), Plan Usage · <range>, or Free Plan Usage This Month. |
| Estimated overage charge | The amount that usage beyond your quota adds. | Shows "recalculating…" while a new range loads. |
| Quota meter | Effective tokens used against your included quota. | Turns amber at 90% and when you go over. Plans with unlimited quota show a full green bar. |
| Effective tokens used | Used tokens and your quota. | |
| Over quota | Effective tokens beyond your quota. | |
| Monthly cap | Your overage spend cap, or No cap. | Set the cap on Settings › Billing. On Free it reads Not available on Free. |
Usage beyond the included quota is billed at cost plus a standard markup and added to your period invoice. If Konkui has given your workspace bonus tokens, a green You've been gifted extra tokens banner at the top shows the recurring monthly bonus and any one-time gift.
If the page can't estimate overage for a range (for example, no billing plan covered it), an Overage estimate unavailable card appears instead. Your usage numbers are still shown.
Fast FAQ — instant answers
When your bot answers a common question straight from your FAQ, without calling an AI model, it is free. The green Fast FAQ — instant answers card counts those answers for the selected range, estimates the AI work they replaced, and shows "฿0 charged" with the approximate amount saved. The card only appears when there were instant answers in the range.
Charts and model breakdown
| Section | What it shows | Notes |
|---|---|---|
| Effective Tokens per Day | Billed usage per day, with the range total on the right. | Hover a point for the exact figure. |
| Effective Usage by Model | The top models by effective tokens. | Uses a log scale so smaller models stay visible next to the main one. |
| Token Distribution by Model | Every model with its billing rate (input and output multipliers), effective tokens and share of the bill. | Internet search shows its number of searches and "Cost + markup" instead of multipliers. |
Use the model breakdown to see what drives your bill. If one expensive model dominates, see What to do when usage is high.
Realtime Rooms Usage
Counts of video conference rooms: Active Rooms, Total Rooms, Inactive Rooms, and a list of recent rooms with their creation time and last activity. With a dated range selected, it covers rooms created in that range. This section is informational only; no limits are enforced. The list refreshes every 30 seconds.
Sandbox Usage
Metrics for Python code your bots run in the sandbox: Total Executions, Avg Duration, Successful (with success rate) and Errors. It follows the selected range.